Beyond the Noise: Buyout Valuations Amid Public Market Volatility
A common question from the investor community is how movements in the public markets affect buyout valuations. Some investors may even question whether valuations in buyout funds are fair, especially in times of market and macro-economic instability like this one. Further scrutiny comes from the fact that we are currently seeing the largest stock of companies in the private markets in history. What is our perspective on the matter? There are several factors that justify a smoother buyout valuation evolution compared to stock markets, and the reasonable valuation practices of many buyout firms.
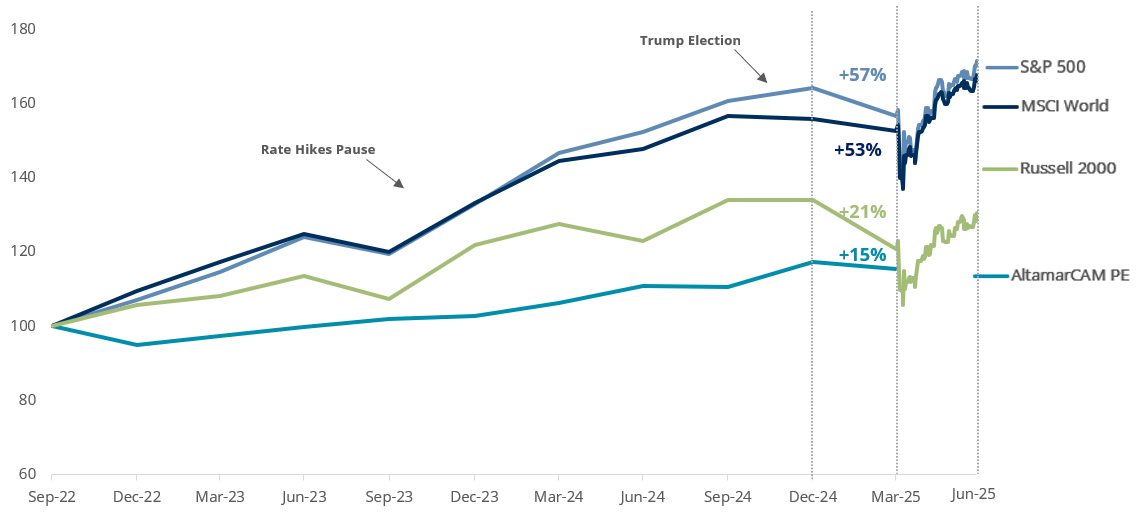
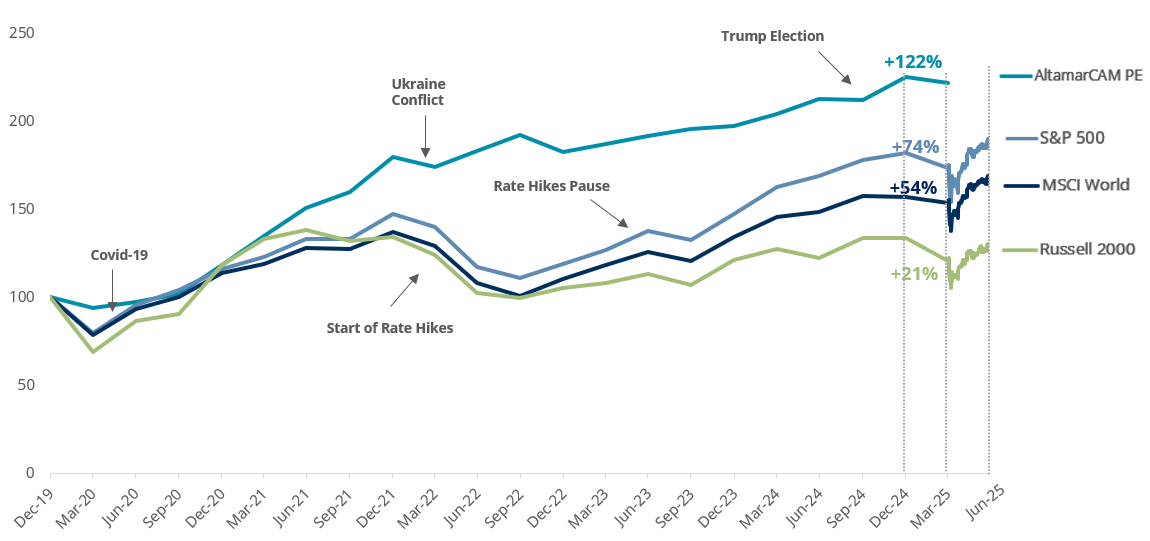
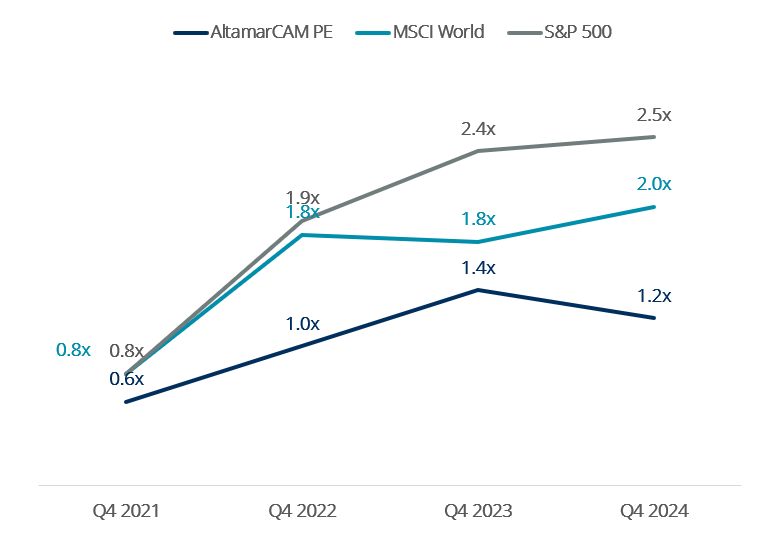
A first top-down approach to valuation evolution reveals that private equity buyout strategies are set for long-term performance. Valuation movements tend to be smoother than those observed in the stock markets, both in upward and downward directions. We cannot hide that stock markets have experienced a strong rally since 2022 bottom, but we can observe that when benchmarked against private equity buyouts since end 2019 (pre-covid), AltamarCAM buyout portfolio performance has been higher than the one in the main public equity indices. Regardless of the time frame considered, it is important to note that valuation fluctuations are smoother in the buyout asset class than in public equity markets as shown in the following charts below:
AltamarCAM PE Portfolio1 vs Listed Indices Quarterly Evolution (3Q 22 to 1Q 25)
AltamarCAM PE Portfolio vs Listed Indices Quarterly Evolution1 (4Q 19 to 1Q 25)
There are several facts supporting this, highlighting four key aspects which are supported by some market and AltamarCAM’s private equity portfolio data:
- Buyout firms typically adopt a proactive approach towards deal sourcing, seeking investments within a very larger universe of private companies when compared to public markets. A discount on public markets is built at the time of investment. AltamarCAM’s buyout portfolio has generally been able to enter deals at more attractive multiples than those seen in the stock market during the 2019-24 period:
Entry Multiple2 Evolution of AltamarCAM PE Portfolio vs Stock Market (EV/EBITDA LTM Median)
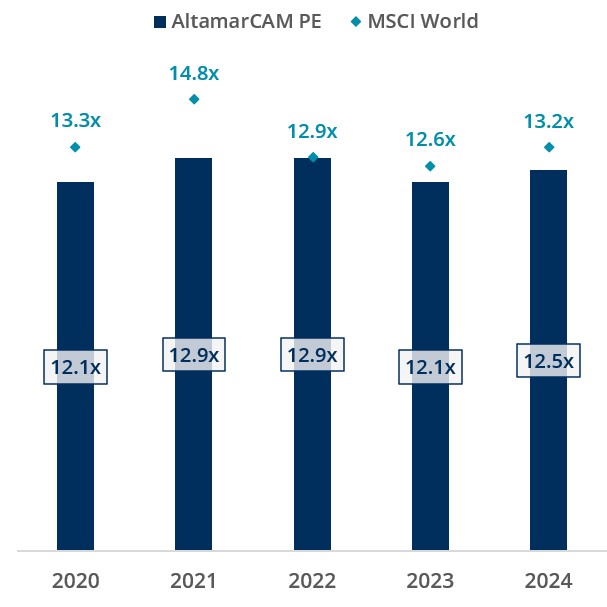
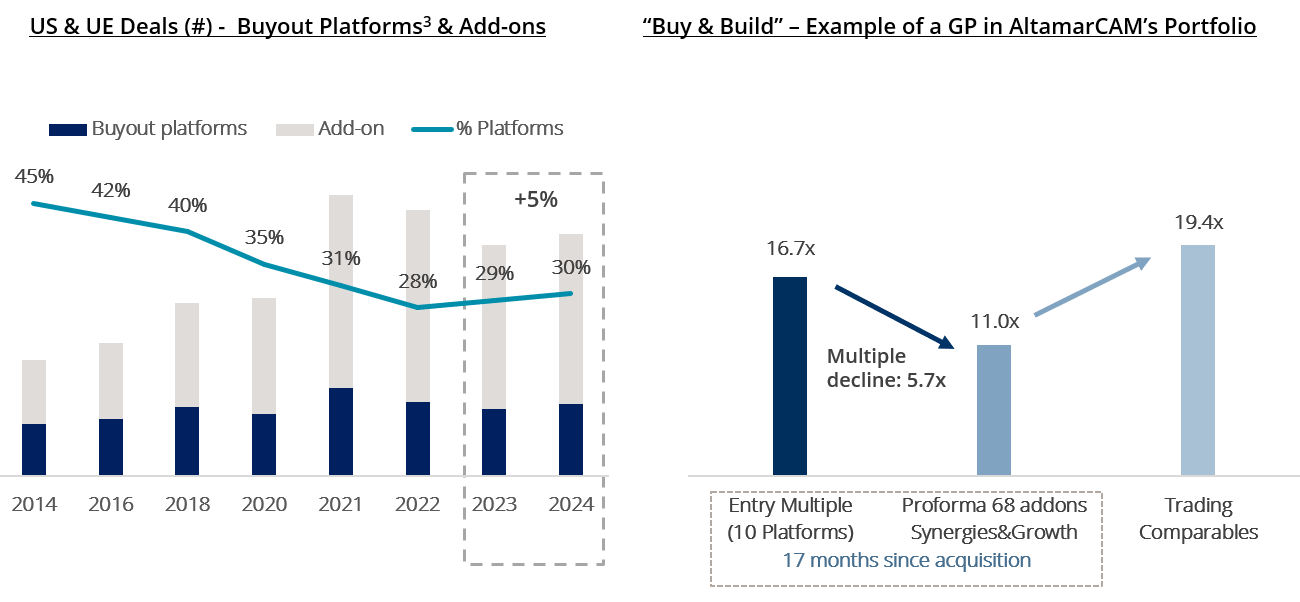
Additionally, the buyout industry has seen increasing activity over the years in buy and build, allowing for a blend down of entry multiples as these are done at accretive multiples not reflected in the market statistics.
- Buyout investments are typically valued on a quarterly or semi-annual basis, as opposed to the real-time valuation experienced in stock markets. Moreover, the most accepted valuation methodologies tend to be based on both listed and private transaction comparable companies: the latter tend to be longer term in nature. It is a usual practice for private equity managers to apply discounts to comparable companies, as the size or business model tends to differ. Additionally, discounted cash flow method is used on some occasions.
- There are notable differences in the sector (and therefore business models) that are accessible in private and public markets, leading to higher average growth in buyouts vs. public companies. When factoring in valuation multiple and growth, we observe that AltamarCAM’s private equity portfolio has been consistently valued below the stock market in the 2019-24 period as seen in the following chart:
Valuation Evolution2 of AltamarCAM PE Portfolio vs. Stock Market (PEG Ratio)
Why such an outcome? Buyout companies are typically smaller, with a higher potential for growth. The sector mix is different, as buyout firms tend to focus their sourcing on long-term secular growth themes. This leads to growing subsectors and business models with several features that increase resiliency in portfolios, as they are characterized by having several of the following features (among others):
- Leading market positions,
- High quality or critical products or services,
- Recurring revenues leading to customer stickiness,
- Customer and / or supplier fragmentation,
- Right platform setup to allow for scalability, etc.
Sector Mix3 & Enterprise Value or “EV” ($b) of AltamarCAM PE Portfolio vs Public Markets
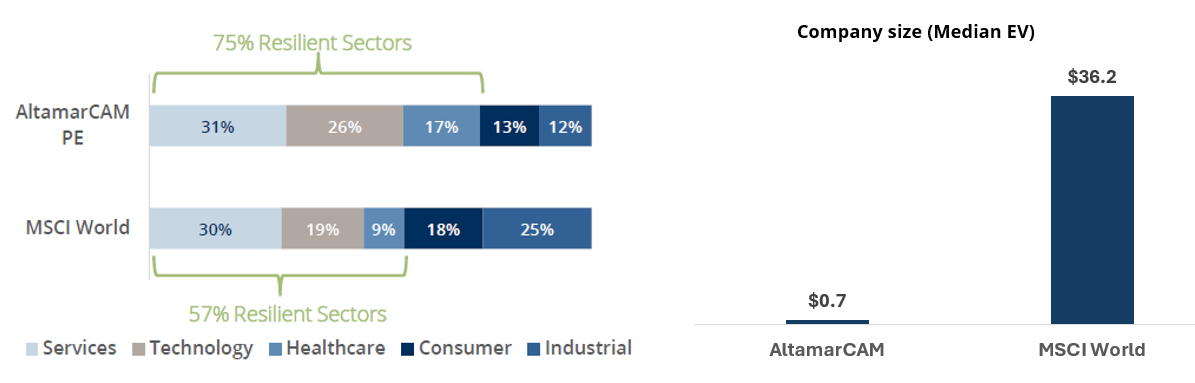
All these tend to translate into businesses with attractive cash flow generation, healthy margins, pricing power, but most importantly, growth (both organic and inorganic, as stated before).
LTM EBITDA4 Growth Evolution (Median, % YoY)

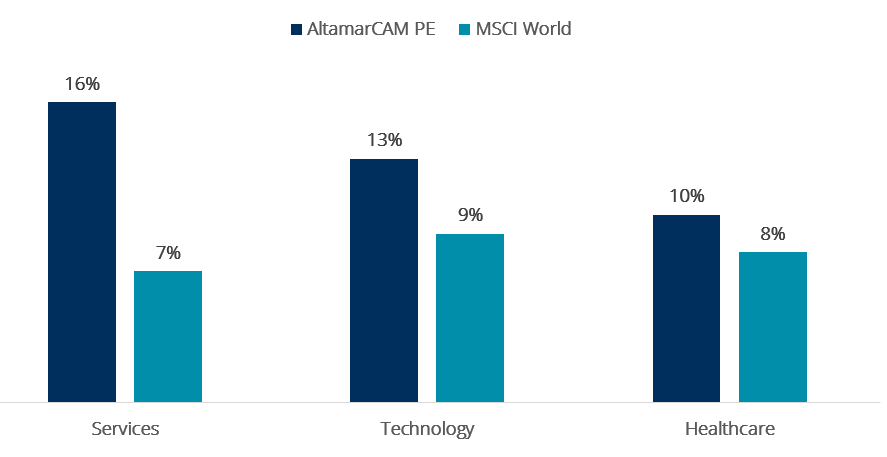
EBITDA4 Growth of Top Sectors (AltamarCAM PE Portfolio vs Stock Market; Q4 19 – Q4 24 CAGR)
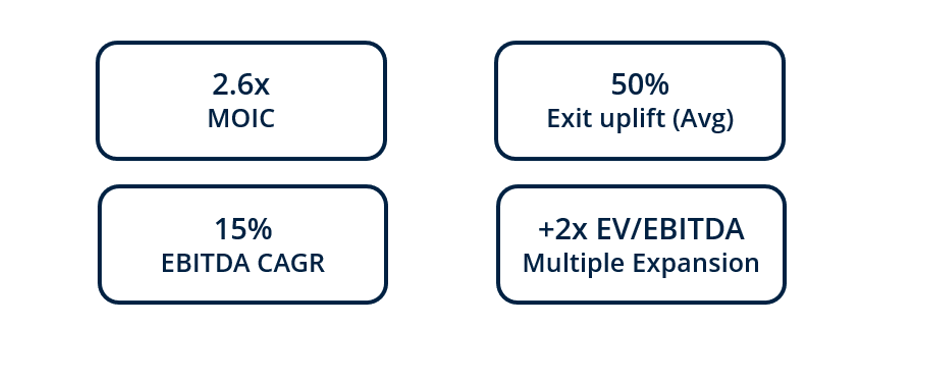
- Finally, buyout managers benefit from tactical flexibility by choosing the optimal exit timing and route, allowing them to achieve a premium vs. MOIC valuations (50% uplift on average vs. valuation 12 months prior to exit for the 2019 to 2024 period). When growth is achieved, they have been able to obtain a premium in exit multiple even in a period of increasing inflation and interest rates, also supported by business and sector quality (+2.0x EBITDA between entry and exit multiple for all realised investments in the same period):
AltamarCAM PE Exits5 (+500 exits in 2019-24 Period)
When observing AltamarCAM’s buyout portfolio, we come to several conclusions:
- Smoother valuation trends: Buyout valuation evolution tends to be smoother than the one of public equity indices.
- Sector focus and growth orientation: Buyout firms concentrate on sectors with long-term secular growth, acquiring businesses at attractive multiples against stock markets which tend to be valued in the portfolio at a discount to the stock market when adjusted for growth.
- Strategic exit flexibility: Buyout managers have the tactical flexibility to choose the optimal exit timing and route, allowing them to achieve a premium against prior marks, based on the transformational growth achieved and the conservative nature of the registered valuations.
All the discussed factors support a smoother buyout valuation evolution against stock markets, and a reasonable valuation methodology applied by buyout firms.
Given these dynamics, it is essential for investors (LPs) to partner with managers that know how to apply value creation measures to influence EBITDA increase, acting on revenues, margins and cash flow optimization to support growth, as well as be tactically smart to source and exit deals.
- Sources: AltamarCAM PE Portfolio measured as evolution of the residual value (NAV) of underlying companies between periods, including the effect of distributions and neutralizing the effect of capital calls between periods. AltamarCAM funds: ACP PE 1, ACP PE 2, ACP PE 3, ACP PE 4, ACP PE 5, ACP PE 6, ACP PE 7, ACPS 1, ACPS 2, ACPS 3, ACPS 4 & ACPS 5. Stock Market Evolution from Investing.com. All stock indices include 0.25% annual fee. For the period 4Q 19 to 4Q 24, the quarterly evolution of the public indexes has been informed, while for the period April 1, 2025 to June 30, 2025, the daily evolution has been informed.
Note: Past returns are not necessarily indicative of future results given that the current economic conditions are not comparable to prior conditions, which may not repeat in the future. There are no guarantees that the funds will have similar results as previous funds
- Source: AltamarCAM internal data (+1,100 companies). The sample includes AltamarCAM PE primaries, secondaries (from 2020 onwards) and co-Investments in North America and Europe. The sample excludes credit investments & other (<1% of the total). MSCI World EV/EBITDA median has been calculated as the median multiple of all the quarters of the year. Portfolio data includes AltamarCAM FoFs: ACP PE 3, ACP PE 4, ACP PE 5, ACP PE 6, ACP PE 6 MM, ACP PE 7, ACP PE 7 LMM, ACPS 2, ACPS 3, ACP S4, ACPS 5, and ACP PE Co-Investments.
The PEG ratio is calculated by dividing the median EV/EBITDA multiple by the median LTM EBITDA CAGR.
Note: Past returns are not necessarily indicative of future results given that the current economic conditions are not comparable to prior conditions, which may not repeat in the future. There are no guarantees that the funds will have similar results as previous funds
- Data obtained from: Q1 2025 European PE Breakdown & Q1 2025 US PE Breakdown Report. Deal Value for the US and Europe have been aggregated. The exchange rate at the end of each year has been used to convert dollar amounts to euros. The number of transactions for the US and Europe were also aggregated. Data for buyout platforms and add-ons. PE Growth/Expansion category was excluded from the sample. The database is constantly updated; hence, historical values may vary slightly from previous filings.
Note: Past returns are not necessarily indicative of future results given that the current economic conditions are not comparable to prior conditions, which may not repeat in the future. There are no guarantees that the funds will have similar results as previous funds
- Source: AltamarCAM internal data (+1,100 companies). The sample includes AltamarCAM PE primaries, secondaries (from 2020 onwards) and co-Investments in North America and Europe. The sample excludes credit investments & other (<1% of the total). MSCI World EV/EBITDA median has been calculated as the median multiple of all the quarters of the year. Portfolio data includes AltamarCAM FoFs: ACP PE 3, ACP PE 4, ACP PE 5, ACP PE 6, ACP PE 6 MM, ACP PE 7, ACP PE 7 LMM, ACPS 2, ACPS 3, ACP S4, ACPS 5, and ACP PE Co-Investments.
Note: Past returns are not necessarily indicative of future results given that the current economic conditions are not comparable to prior conditions, which may not repeat in the future. There are no guarantees that the funds will have similar results as previous funds
- Source: AltamarCAM internal data (+1,100 companies). The sample includes AltamarCAM PE primaries, secondaries (from 2020 onwards) and co-Investments in North America and Europe. The sample excludes credit investments & other (<1% of the total). MSCI World EV/EBITDA median has been calculated as the median multiple of all the quarters of the year. Portfolio data includes AltamarCAM FoFs: ACP PE 3, ACP PE 4, ACP PE 5, ACP PE 6, ACP PE 6 MM, ACP PE 7, ACP PE 7 LMM, ACPS 2, ACPS 3, ACP S4, ACPS 5, and ACP PE Co-Investments. +500 companies exited during the 2019-2024 period, delivering 2.6x Gross MOIC (primaries and co-investments). Exit uplift data excludes IPOs.
Note: Past returns are not necessarily indicative of future results given that the current economic conditions are not comparable to prior conditions, which may not repeat in the future. There are no guarantees that the funds will have similar results as previous funds
IMPORTANT NOTICE:
This document has been prepared by Altamar CAM Partners S.L. (together with its affiliates “AltamarCAM“) for information and illustrative purposes only, as a general market commentary and it is intended for the exclusive use by its recipient. If you have not received this document from AltamarCAM you should not read, use, copy or disclose it.
The information contained herein reflects, as of the date hereof, the views of AltamarCAM, which may change at any time without notice and with no obligation to update or to ensure that any updates are brought to your attention.
This document is based on sources believed to be reliable and has been prepared with utmost care to avoid it being unclear, ambiguous or misleading. However, no representation or warranty is made as of its truthfulness, accuracy or completeness and you should not rely on it as if it were. AltamarCAM does not accept any responsibility for the information contained in this document.
This document may contain projections, expectations, estimates, opinions or subjective judgments that must be interpreted as such and never as a representation or warranty of results, returns or profits, present or future. To the extent that this document contains statements about future performance such statements are forward looking and subject to a number of risks and uncertainties.
This document is a general market commentary only, and should not be construed as any form of regulated advice, investment offer, solicitation or recommendation. Alternative investments can be highly illiquid, are speculative and may not be suitable for all investors. Investing in alternative investments is only intended for experienced and sophisticated investors who are willing to bear the high economic risks associated with such an investment. Prospective investors of any alternative investment should refer to the specific fund prospectus and regulations which will describe the specific risks and considerations associated with a specific alternative investment. Investors should carefully review and consider potential risks before investing. No person or entity who receives this document should take an investment decision without receiving previous legal, tax and financial advice on a particularized basis.
Neither AltamarCAM nor its group companies, or their respective shareholders, directors, managers, employees or advisors, assume any responsibility for the integrity and accuracy of the information contained herein, nor for the decisions that the addressees of this document may adopt based on this document or the information contained herein.
This document is strictly confidential and must not be reproduced, or in any other way disclosed, in whole or in part, without the prior written consent of AltamarCAM.