Portfolios of Funds –
Homemade or Outsourced?
Investors in private assets need to be mindful about costs, extensive diversification, and manager proliferation. Hiring myriad managers does not ensure they will be winners collectively. To the contrary, the law of averages works against investors.
In our white paper Targeting Private Assets, we examine the performance of the endowment model. R. Ennis2 finds that, since the Global Financial Crisis, endowments have underperformed their risk-based benchmarks, a public fund composite, and a 70% equities / 30% bonds passive portfolio.
R.Ennis identifies two key performance drags:
- High costs and overdiversification. Overdiversification tends to reduce the overall specific business exposures that private equity managers seek. With such high diversification, endowments cannot overcome the impact of high active management fees.
- Manager proliferation. Large endowments have an average of over 100 asset managers and in excess of 1,000 active company bets that, unfortunately, end up cancelling one another out.
K. Polen makes three most sensible recommendations:
- Focus on the quality of the business approach in creating a strategic advantage,
- Assess the quality of the organization, and
- Give paramount importance to the alignment of interests.
Clearly, thus, investors in private assets need to be mindful about costs, extensive diversification, and manager proliferation. Hiring myriad managers does not ensure they will be winners collectively. To the contrary, the law of averages works against investors.
These insights and recommendations by both Ennis and Polen are most relevant to the question as to whether investors should create their very own portfolio of funds or outsource the manager selection and portfolio construction process through a fund of funds.
In its 2020 Private Equity and Venture Capital report, Preqin provides comparative data for the relative size and performance of funds of funds, including balanced funds diversified across growth stages:
Private Equity: Risk/Return by Fund Type (Vintages 2007-2016)
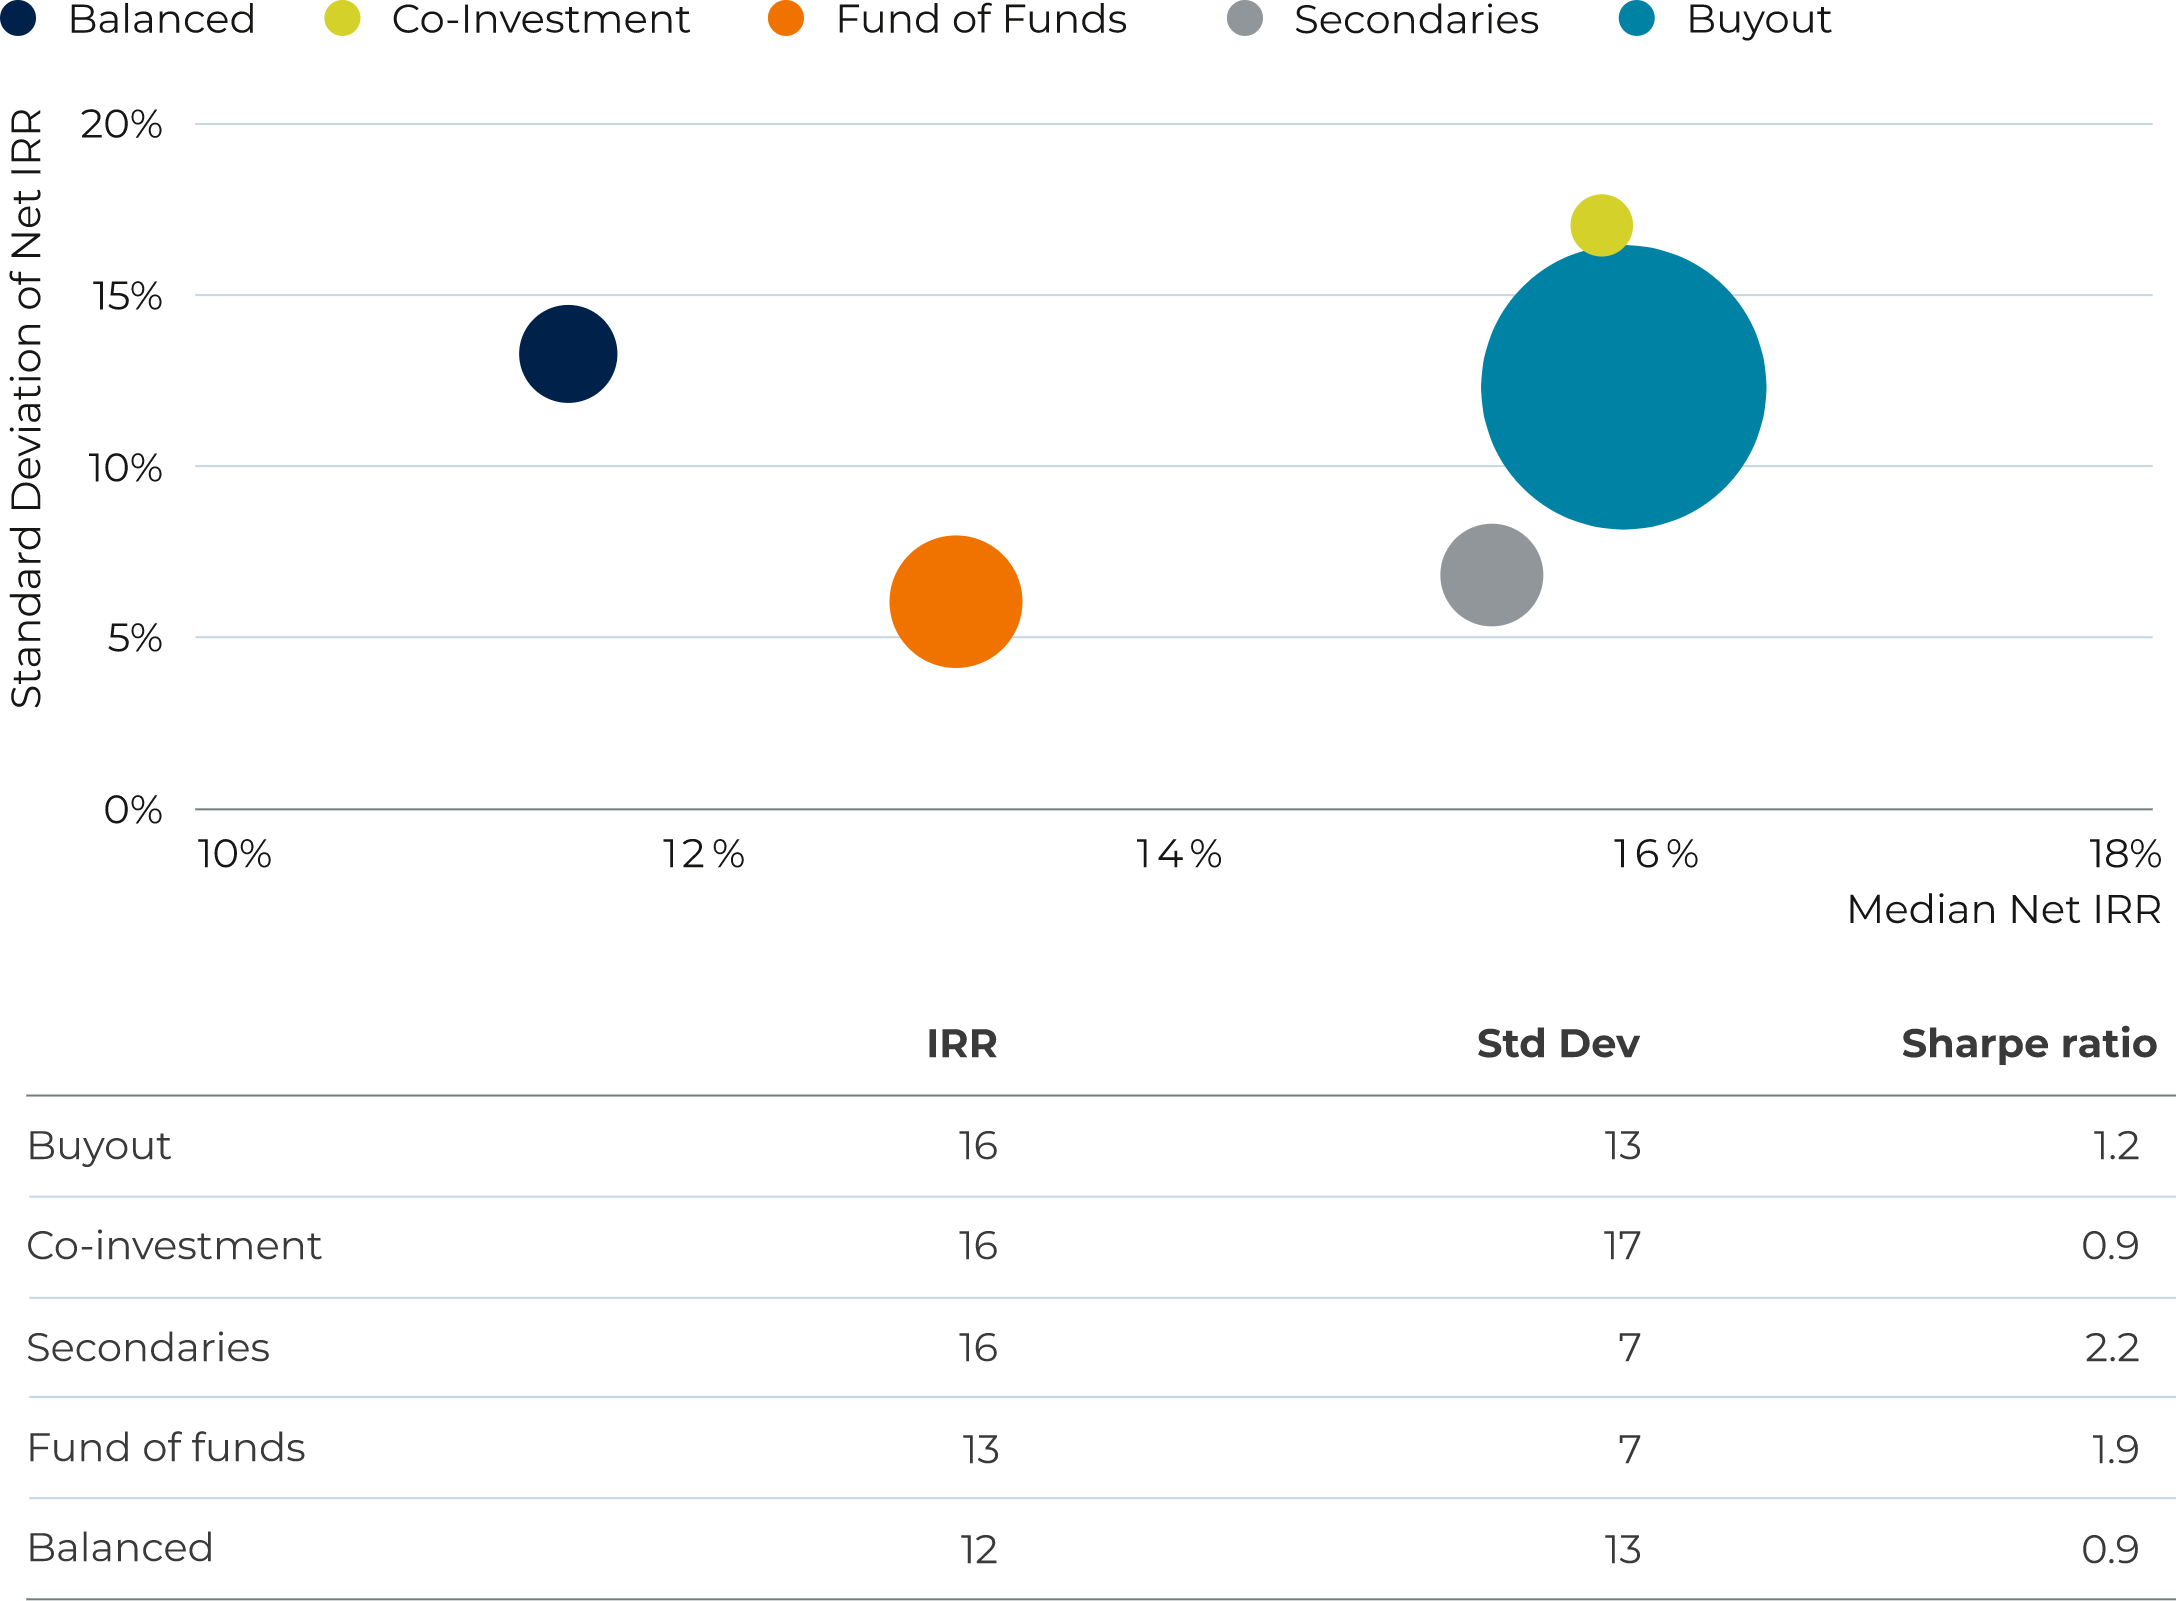
For the vintages 2007 – 2016, funds of funds delivered 3 a Sharpe ratio of 1.9x, clearly outperforming the average of buyout funds – Sharpe ratio of 1.2x – and balanced funds diversified by stage and approach – Sharpe ratio of 0.9x. Funds of funds do seem to be earning their fees through astute manager selection and robust portfolio construction and risk management.
Diversified portfolios of funds managed internally with the appropriate processes, teams, and experience could potentially achieve results similar to those achieved by funds of funds. The experience of the endowment funds, however, should serve as a warning about creating and indulging in excessive complexity.
Robert S. Harris recently published a paper in the journal of Financial Economics studying the performance of funds of funds. Very insightfully, Harris questions whether the large blue universe of single funds in the chart above is the appropriate benchmark for funds of funds in as much as investors “would find it difficult to invest in (single managers) directly”. So, the large blue dot may not even represent the actual opportunity set of investors.
To summarize, funds of funds outperform the single fund universe on a risk-adjusted basis. Furthermore, this universe may not be the appropriate benchmark as investors do not have access to all the managers in this universe.
1This is not an investment recommendation
2Richard M. Ennis: https://richardmennis.com/blog/endowment-performance
3Past performance is no guarantee of future returns.
Venture Capital as an Access Class
Returns for 60/40 long-only strategies are driven primarily by the asset class itself not by the performance of top managers. Unlike 60/40 strategies, returns for investors in private assets are critically determined by access to the best managers.
The average dispersion from median to top manager has been 3.3% for traditional 60/40 long-only strategies. Dispersion for private equity is 21.2% and for venture capital, a staggering 33.3%, a tenfold increase over long-only 60/40 strategies.
Whereas in 60/40 strategies deploying capital is not an issue, it happens to be the key make-it-or-break-it issue in private assets, particularly so in venture capital. In venture capital, the name of the game is access. That is why we regard venture capital as an access class. No premium access, no premium returns above the median. To get top results, you need top access.
An asset class is a coherent grouping of securities that share similar characteristics and common risk factors. These risk factors cannot be diversified away. As a result, securities within each asset class earn an inherent non-skill-based return.
The standard asset classes are bonds and equities. Over the past 10 years, infrastructure and credit have become accepted as bona fide asset classes that should be included in the strategic asset allocation opportunity set. What about venture capital?
What can we take away from this analysis?
A key test as to whether an asset grouping deserves status as an asset class at the strategic asset allocation level is running optimization numbers, as we have done in our most recent white paper Targeting Private Assets.
We start with money markets, bonds, and equities, allow the optimizer to allocate up to 20% to liquid alternative strategies, and then let it allocate to venture capital as much as it thinks fit. Here are the results:
Frontier Area – Venture Capital
Source: Eccleston Partners
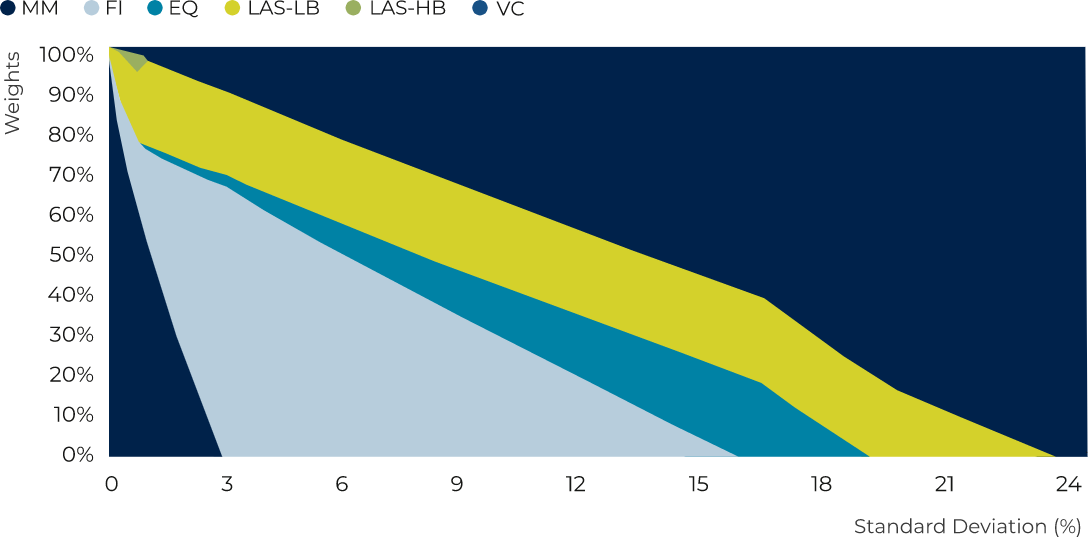
MM – Money Markets, FI – Fixed Income, EQ – Equities, LAS – Liquid Alternative Strategies, LB – Low Beta, HB – High Beta, VC – Venture Capital
The optimizer would allocate as much as the risk budget would allow! What an asset class to be invested in. Venture capital has an expected Sharpe ratio of .41 vs .17 for bonds and .35 for equities. It also has an expected correlation of 0 with bonds and .7 with equities. No wonder the optimizer falls in love with venture capital.
Once we have venture capital in our long-term asset allocation, we need to access managers. Let’s start taking a look at returns delivered by asset classes and by top 5th percentile managers across 60/40 long-only strategies, alternative liquid strategies, and private assets:
Average Annual Manager Returns by Asset Class
July 1, 2008 – June 30, 2018.
Source: Cambridge Associates LLC.
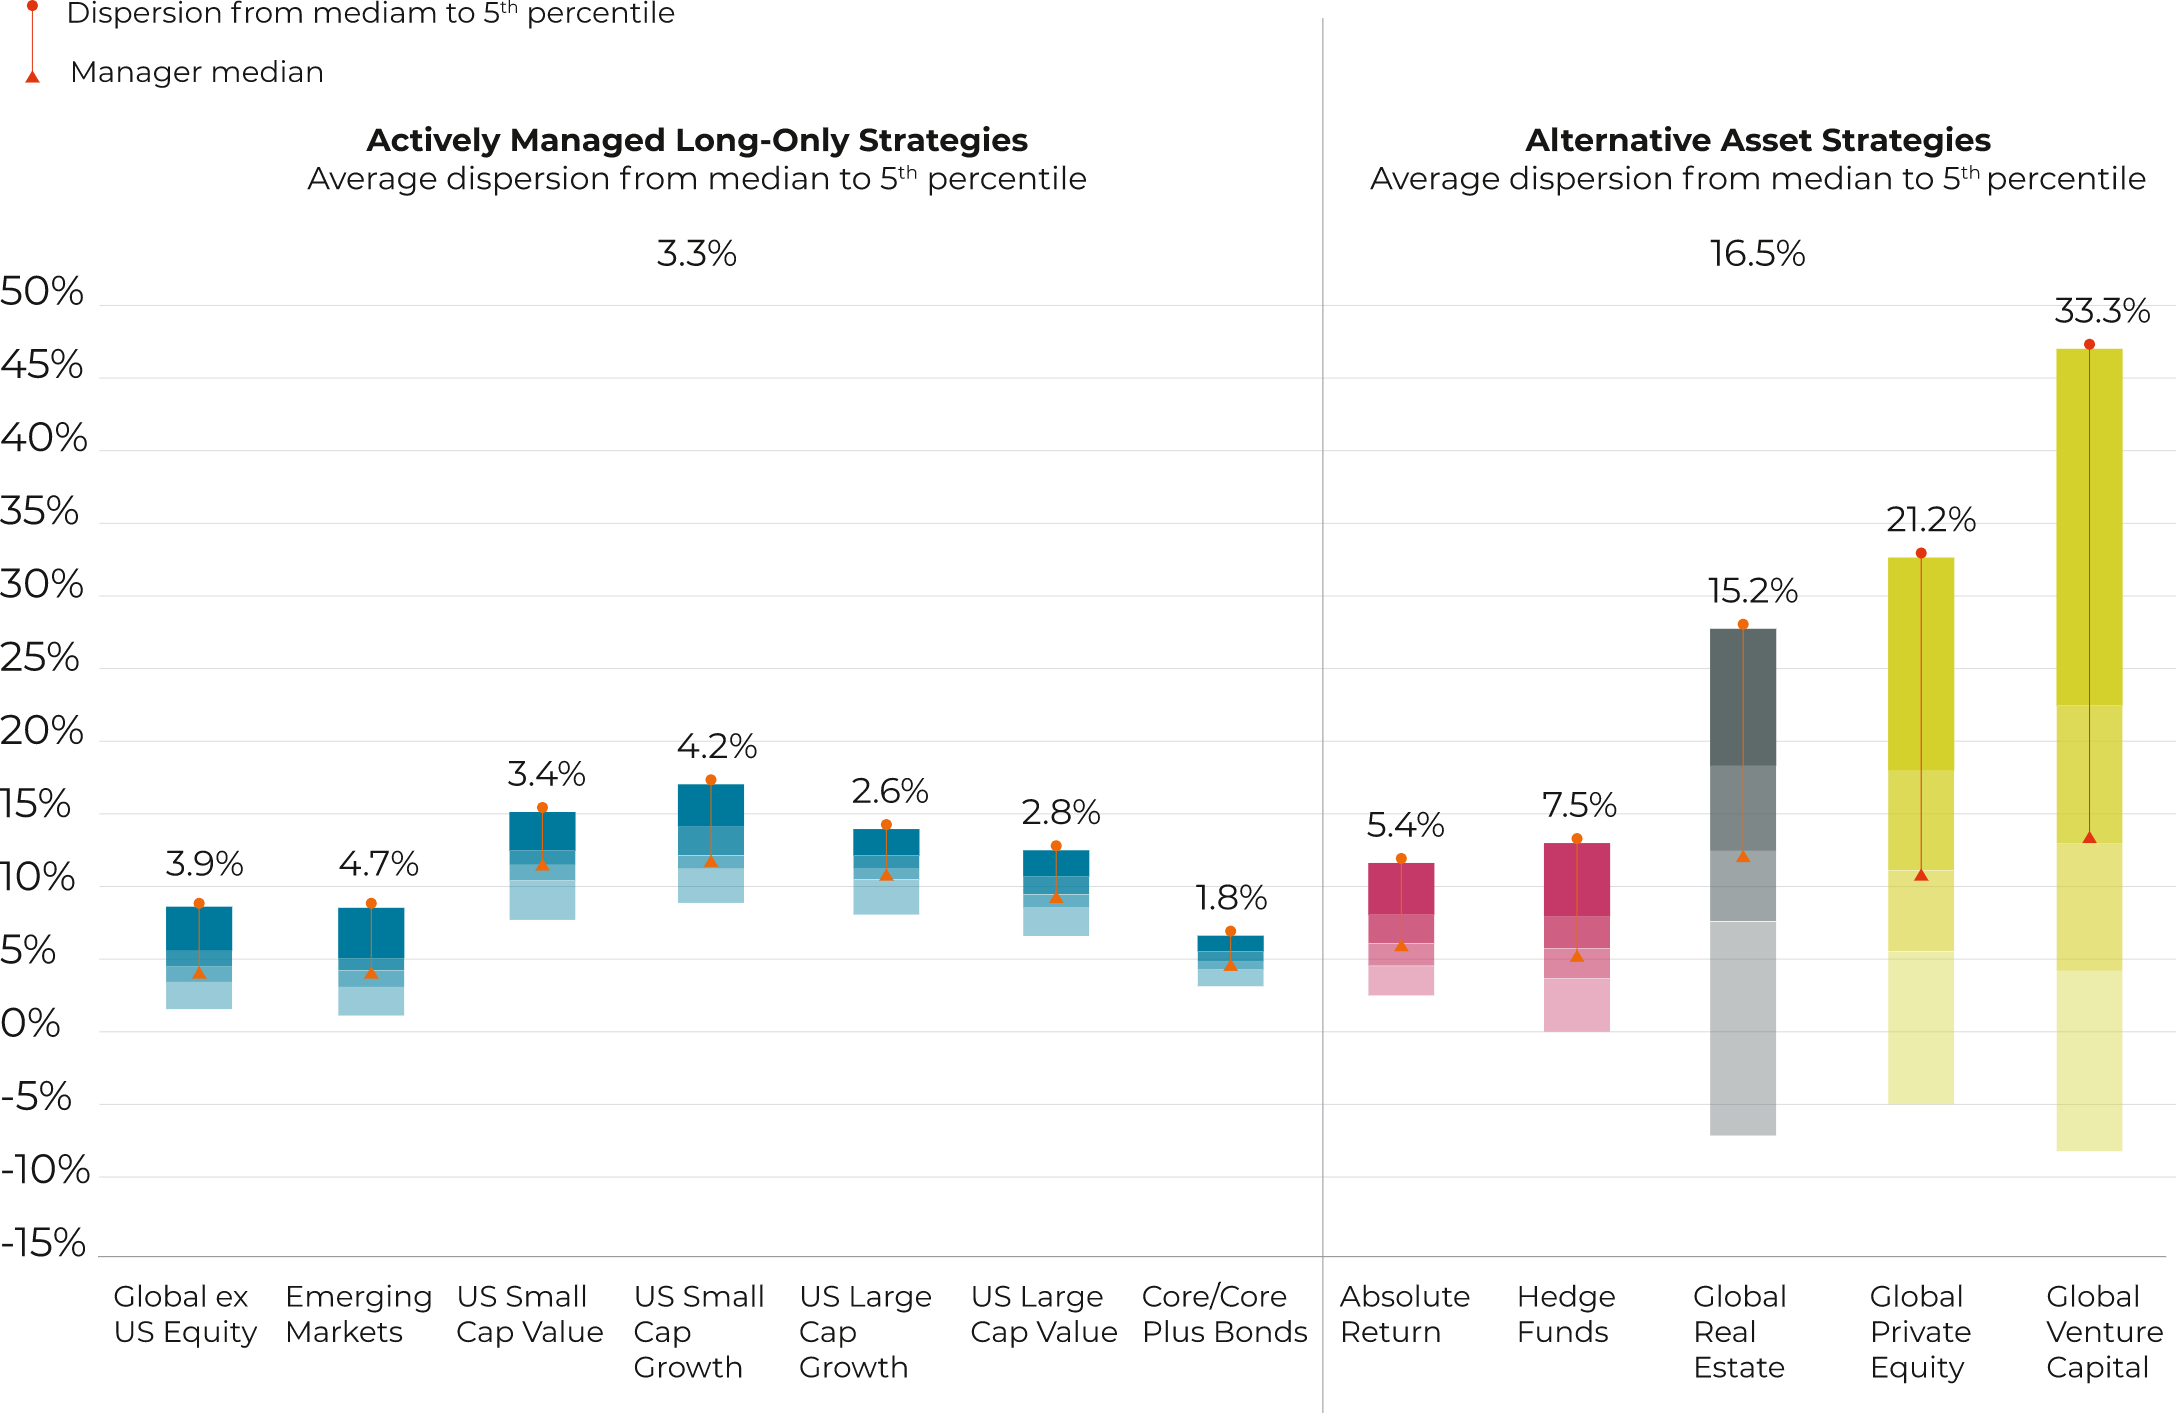
Note: Returns for bond, equity, and hedge fund managers are average annual compound returns (AACRs) for the ten years ended June 30, 2018. Only managers with performance available for the entire period are included. Returns for private investment managers are horizon internal rates of return (IRRs) calculated since inception to March 31, 2018. Time weighted returns (AACRs) and money weighted returns (IRRs) are not directly comparable.
Returns for 60/401 strategies are driven by the asset class itself not by the performance of top managers. To illustrate, US large cap value strategies have earned about 8% per annum over the 10 years in the study period. Top 5th percentile managers have added 2.8% per annum. For these outstanding managers, skill has thus contributed about 25% of returns and asset class beta about 75%. For the seven sub asset classes, the average dispersion from median to top manager has been 3.3%.
As we look to liquid alternative strategies and illiquid private assets in the right, we appreciate that median returns continue stuck in the 5 to 10% range but that dispersion skyrockets. It is now 21.2% for private equity and a staggering 33.3% for venture capital, a tenfold increase over long only 60/40 strategies. In private assets, getting the right manager is key and particularly so for venture capital.
Persistence of Performance
This dispersion between great and poor managers in venture capital has persisted over time:
Net IRR per Vintage and Fund Type
Source: Cambridge Associates Benchmarks Index as of Q4 2020.
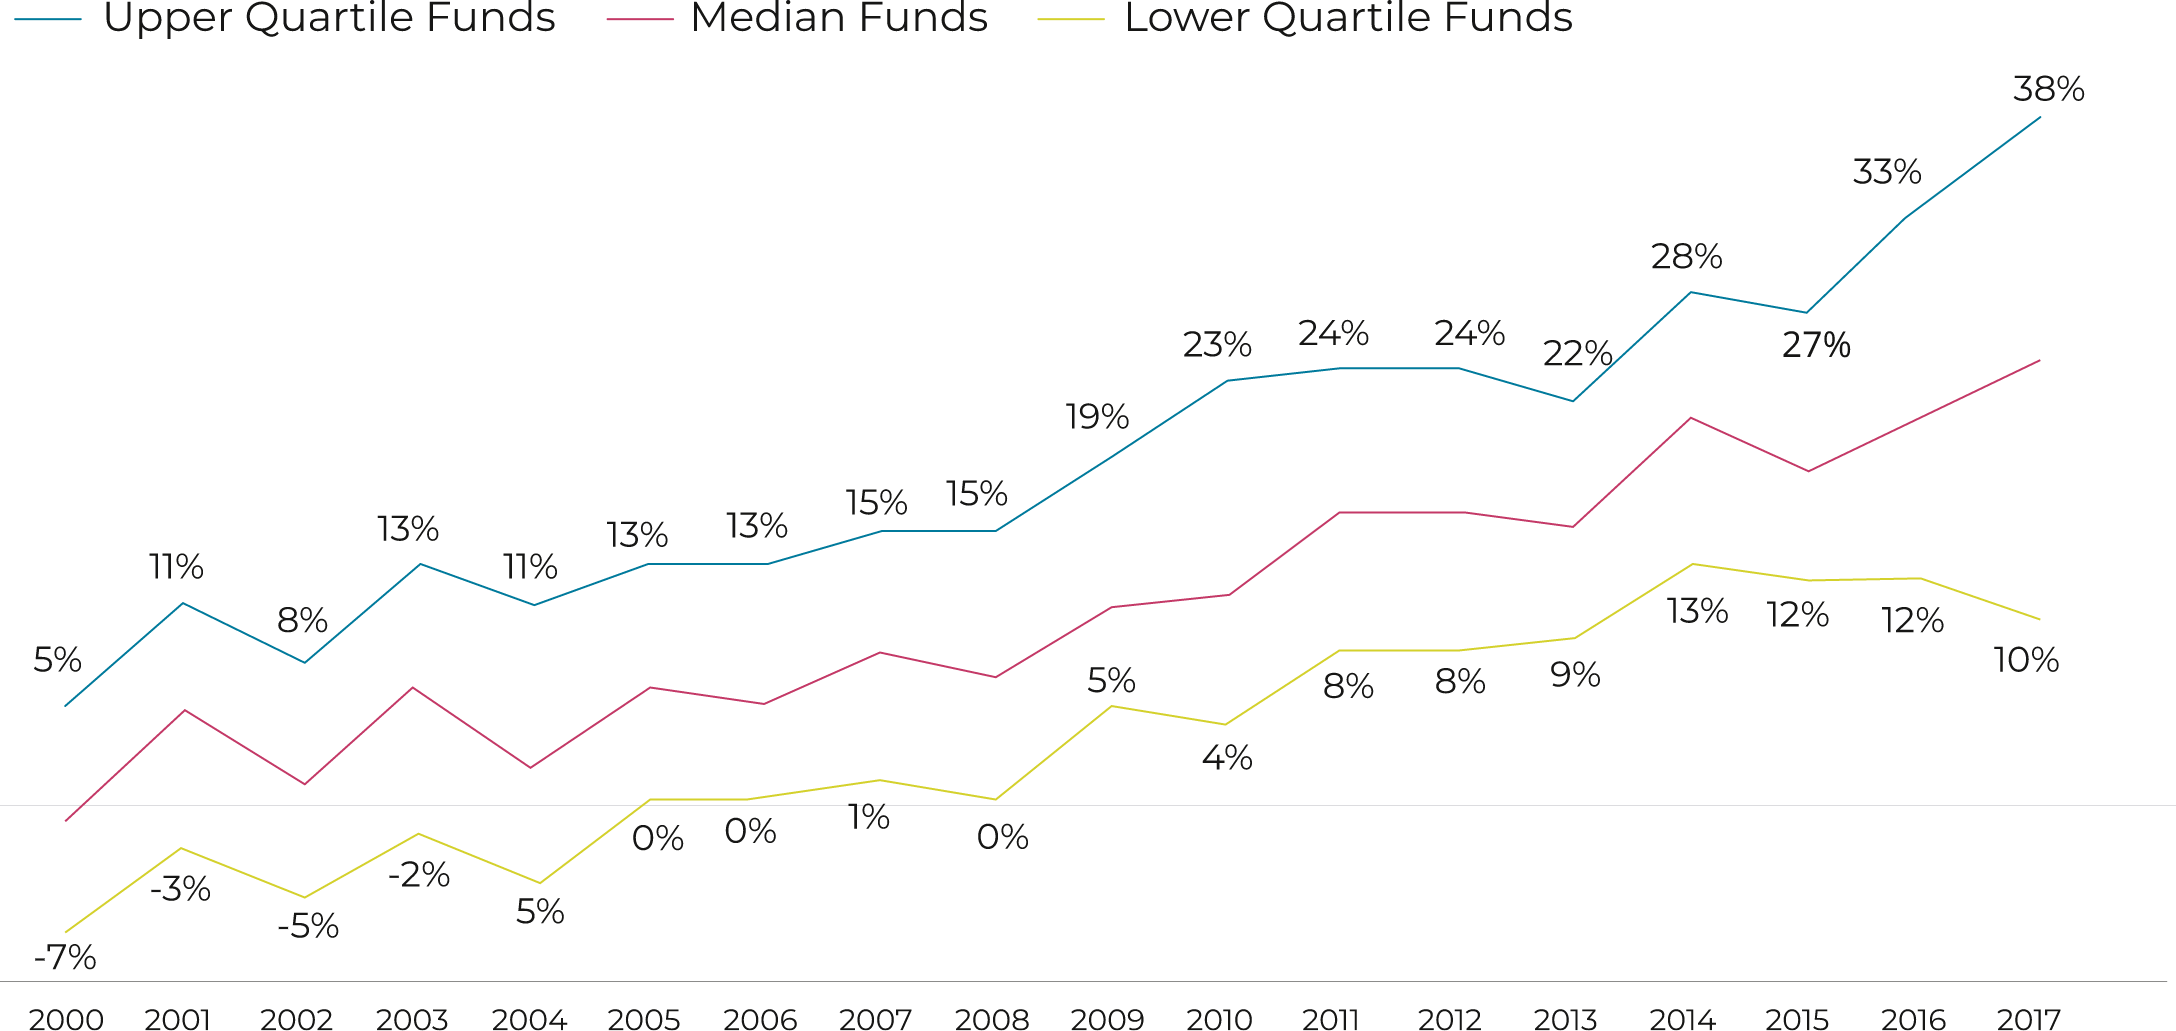
Finally, empirical evidence reveals that there is persistence in those that make it to the upper quartile. Managers up there do not rotate in and out every quarter. The industry´s rule of thumb of investing with GP´s that have previously performed well and avoid those that have not remains consistent with these empirical results.
Here we meet the limitations of venture capital as an asset class. Whereas in long only 60/40 strategies deploying capital is not an issue, it happens to be the issue in venture capital. In venture capital, the name of the game is access. That is why we regard venture capital as an access class rather than an asset class. No premium access, no premium returns above the median. To get top results, you need top access.
How do we know? Just take a look at our track record, as detailed in our white paper Targeting Venture Capital.
TVPI Track Record – Galdana and Preqin
Source: Galdana and Preqin.
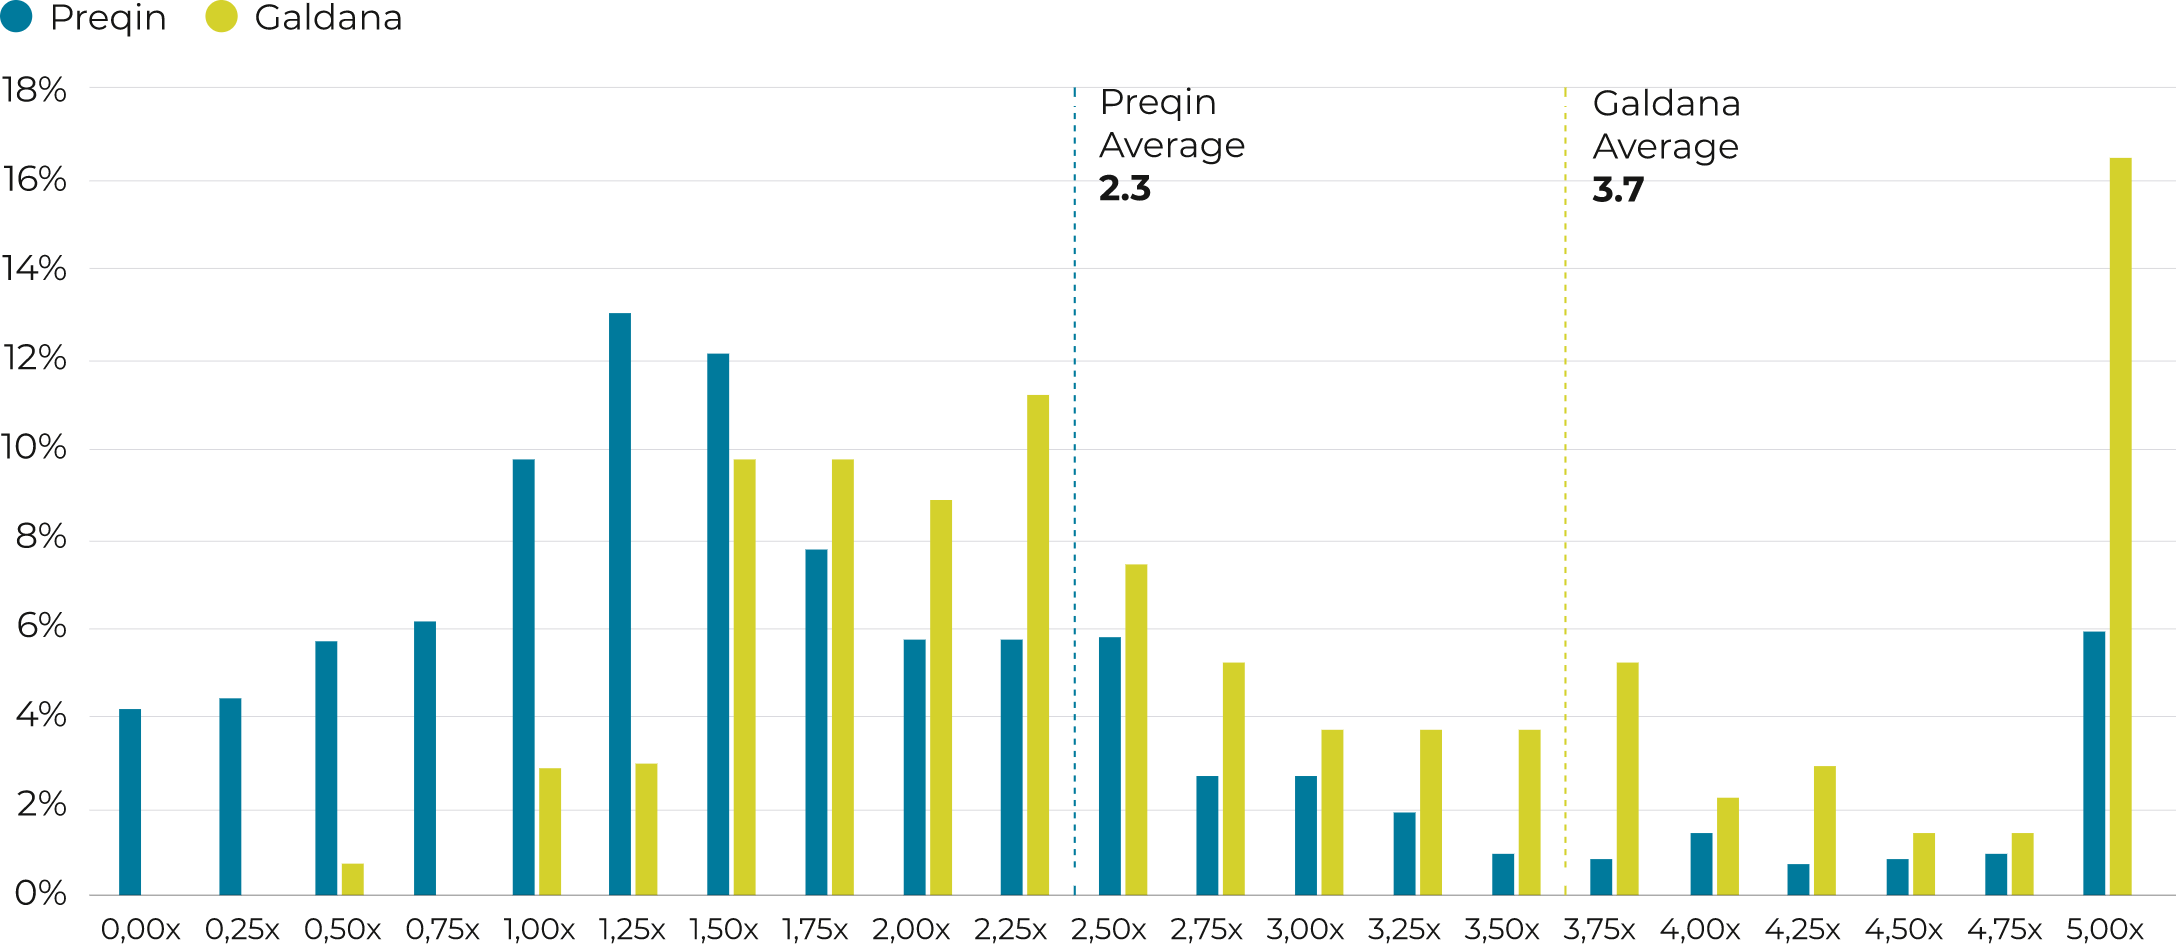
- Over 20% of Preqin’s sample delivers TVPI’s below 1.0x. In the case of Galdana’s managers, the rate stands at just below 1%. Let’s new look at winners.
- In Preqin’s sample, not quite 10% of funds earn TVPI’s in excess of 4.0x. Galdana’s percentage of big winners stands in excess of 20%. Funds earning TVPI’s of 5x or higher stand at over 15%.
2Past performance does not guarantee future returns.
3It comprises the investments made by Galdana Ventures FCR, Galdana Ventures II FCR, Galdana SPV I, S.C.A., SICAV-RAIF and Galdana Ventures II, SICAV-RAIF.
4This note draws on our white paper Targeting Venture Capital which you can access through our website. The white paper provides further details and references on data sources.
5This is not an investment recommendation.
José Luis Molina's interview on the current situation in private markets
AltamarCAM’s CEO José Luis Molina discussed the current situation in private markets at the SuperReturn International last June, including how the current macro situation could affect private markets.
José Luis argued that these are times for investors to be cautious and patient because of geopolitics, inflation, rising interest rates, etc. Nonetheless, this environment is usually a good time to find good investment opportunities.